US GDP Growth a Solid 3%, But Is Trouble Ahead?

At first glance, everything seems to be going just fine: the economy is growing (the latest revised second quarter estimate came in at a solid 3%), the Fed is raising interest rates (allegedly because, according to the experts, everything is going remarkably well) and inflation remains subdued. But something is happening below the surface that cannot be directly observed from the headline numbers. Let me show you four charts that clearly show that beneath the surface things are not as pretty as they seem.
Danger Sign #1: Businesses Are Reducing Investments in New Inventories
“The only source from which an entrepreneur’s profits stem is his ability to anticipate better than other people the future demand of the consumers”, as Ludwig von Mises so aptly described in his masterpiece Human Action. For the moment, entrepreneurs seem to anticipate lower final demand.
Now, there exists a possibility that entrepreneurs are plain wrong. Markets are not perfect, as Mises would agree, but entrepreneurs assume a cost for being wrong and obtain profits for being right. However, the data suggests that entrepreneurs are, on the whole, reasonably efficient in estimating future demand. Take a look at the following chart:
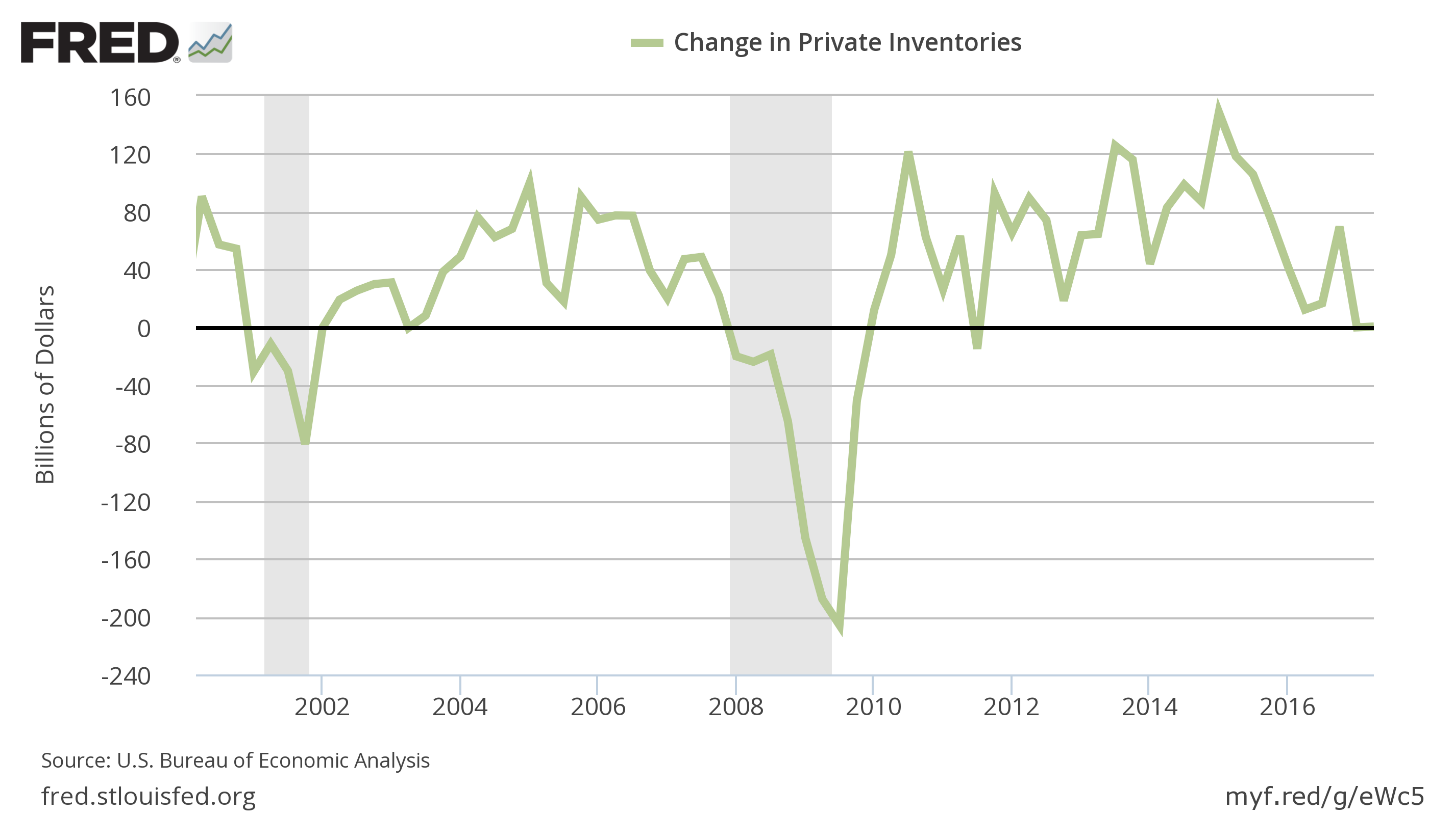
The Bureau of Economic Analysis (BEA) includes in its GDP measure a component that tracks changes in private inventories. The theory is that inventories turn into final sales (another component in GDP). Both should, therefore, counterbalance the other. Whenever final sales go up, inventories go down. Whenever final sales go down, inventories go up.
A problem arises when businesses are both reluctant to invest in inventories and final demand is sluggish. On some occasions, inventory growth even goes negative. In that case, entrepreneurs do not only decide to cut back on additional investment in inventories, but even forego replacing sold inventory.
As you might observe in the above chart, inventory growth does not go negative often. Inventory growth went negative this year, which in the past two decades has only happened three times before: in 2011, 2009 and 2001.
The change in private inventories is a cyclical variable. Following in Mises’ footsteps, we can see that they are proxy of an entrepreneur’s anticipation of future demand. And for now, their reluctance to invest in new inventories suggest lower future demand and possibly an economic downturn.
Danger Sign #2: The Car Industry Is Heading for Trouble
Cyclical consumer industries are precisely cyclical because they largely depend on the availability and price of credit. The car industry is perhaps the best case in point. Tracking sales and inventory growth in the car industry is a next to perfect proxy for cyclical consumer demand.
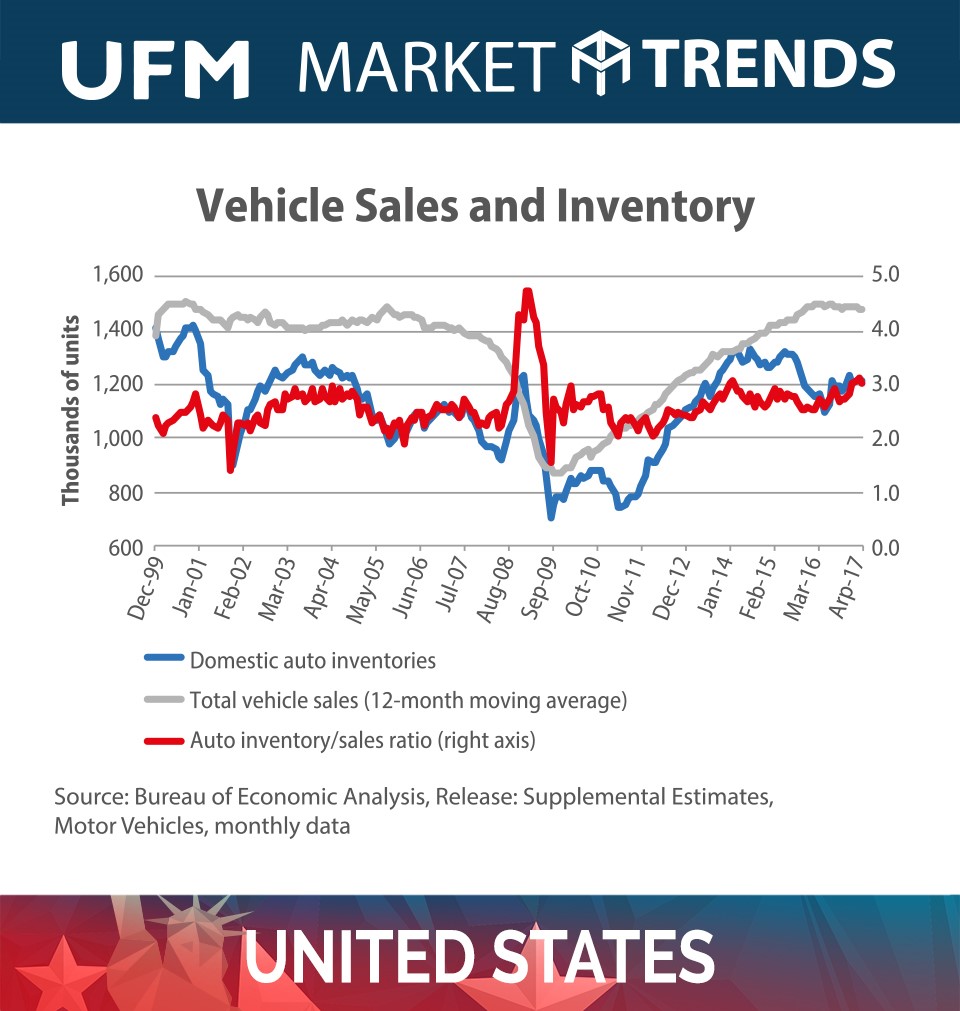
They were never this high, car sales in the US. Or, at least, until recently. The miraculous recovery of the car industry is beginning to suffer the consequences of declining sales. It should be no surprise that a bubble has developed in the car industry: a bubble which has, surprisingly, many things in common with the subprime-mortgage crisis of 2008, in which lending standards were lowered and banks began to lend more, at longer maturities and to the wrong people.
That could become a thing of the past very soon. The bubble in the auto industry might have burst: car sales, compared to a year earlier, decreased by almost 5%.
Not only that: car inventories are on the rise; unsold cars are accumulating. The last time that car inventories, relative to annual sales, were as high as today, was in 2008. In short: bad news. Car inventories are rising; car sales declining. The car industry is beyond repair.
The Fed is watching the same data. Eight times a year, the Fed publishes the equivalent of our quarterly UFM Market Trends report, better known as the “Beige Book” (but which actually carries the title “Summary of Commentary on Current Economic Conditions”). In the latest release, the Fed came to the following conclusion, which happens to coincide with our own conclusion: “(…) [M]any Districts noted some softening in consumer spending, particularly in auto sales which declined in half of the Districts.”
Danger Sign #3: Banks Are Scrambling for Liquidity and Are Reducing Maturity Mismatches
What does a simplified bank balance sheet look like in our present era? The answer to that question is not difficult to guess. On the right side, the liability side, we will mostly find demand deposits with a maturity of practically zero. On the left side, the asset side, we will mostly find long-term commercial and consumer credit (to a large degree residential mortgages with long maturities). In sum, historically speaking, maturity mismatches were never as big as they are today.
What did banks do in the past?
Banks held the very same demand deposit on the liability side. However, they invested the funds entrusted to them by their depositors to a large extent in very liquid commercial credit with short maturities (less than 90 days). Granted, they also invested in government debt. But, in contrast to today, most of it was invested in government debt with maturities of less than a year.
In a boom phase of (artificial) economic expansion, banks increasingly mismatch maturities of assets and liabilities. They invest at ever longer maturities. But at a certain point, a systemic shortage of liquidity emerges. The first banks begin to reduce their maturity mismatches drastically (reminiscent to Margin Call, an extremely entertaining movie featuring Kevin Spacey). They begin to cut long-term loans and investments and recover (partly) their illiquid asset-liability structure.
And that normally means a recession is around the corner.
Ironic, isn´t it? Banks forewarn us a storm is coming by the maturity mismatches between assets and liabilities that they are willing to bear at any certain point. This is what happened with maturity mismatches over the past few years:
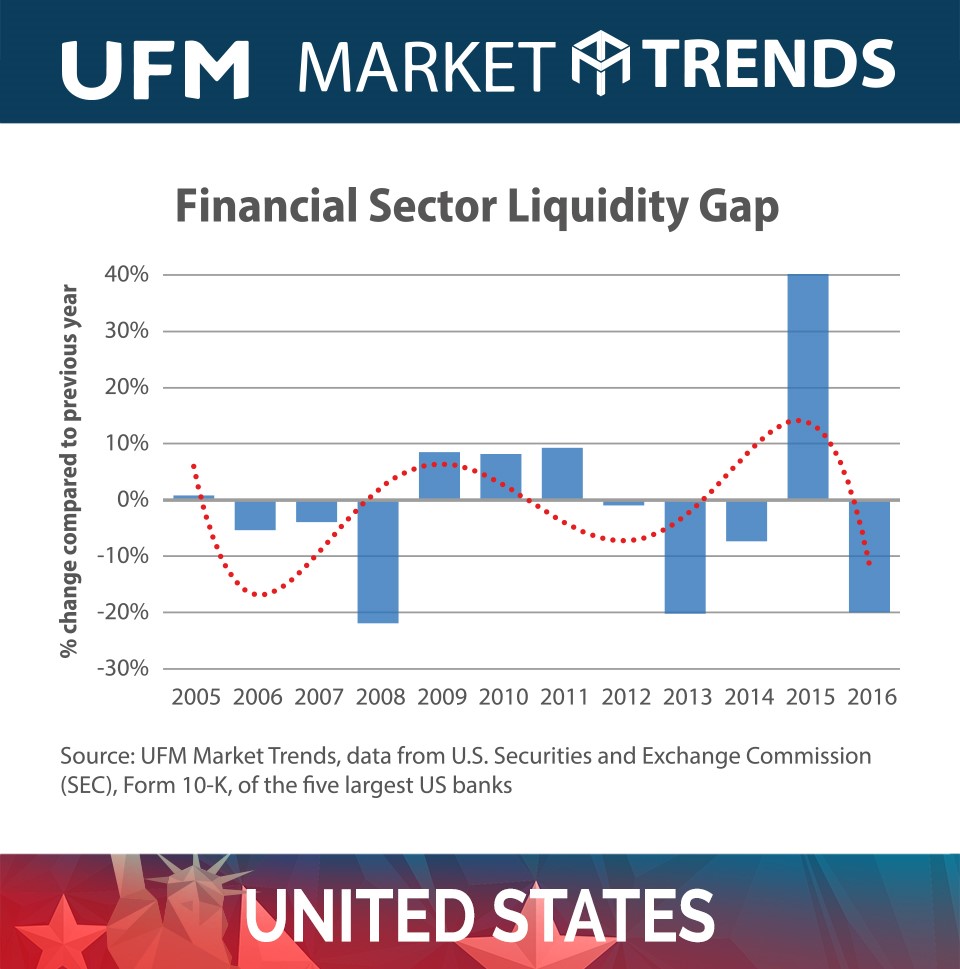
In 2008, our liquidity gap measure provided a clear warning: trouble ahead. The decrease in 2013 seems to be a “false positive,” but we should not forget that US GDP decreased 1.2% in the first quarter of 2014, which was the first period of negative growth since the 2008 crisis. Since the NBR arbitrarily defines a recession as “two subsequent quarters of negative GDP growth,” we tend to forget about these down quarters.
The decrease in US GDP in Q1 2014 was followed by a miraculous recovery in 2015, until now. Because now, in 2016, the floodgates seem to have opened: the five major US banks are scrambling for liquidity.
The data is somewhat lagging (banks are obliged to disclose maturities only on an annual basis), so it is difficult to know what is really happening in 2017 with banks’ balance sheets. However, the fact that banks have reduced maturity mismatches substantially appears to be bad news for the US economy.
Danger Sign #4: Corporate Credit Growth Is Weakening
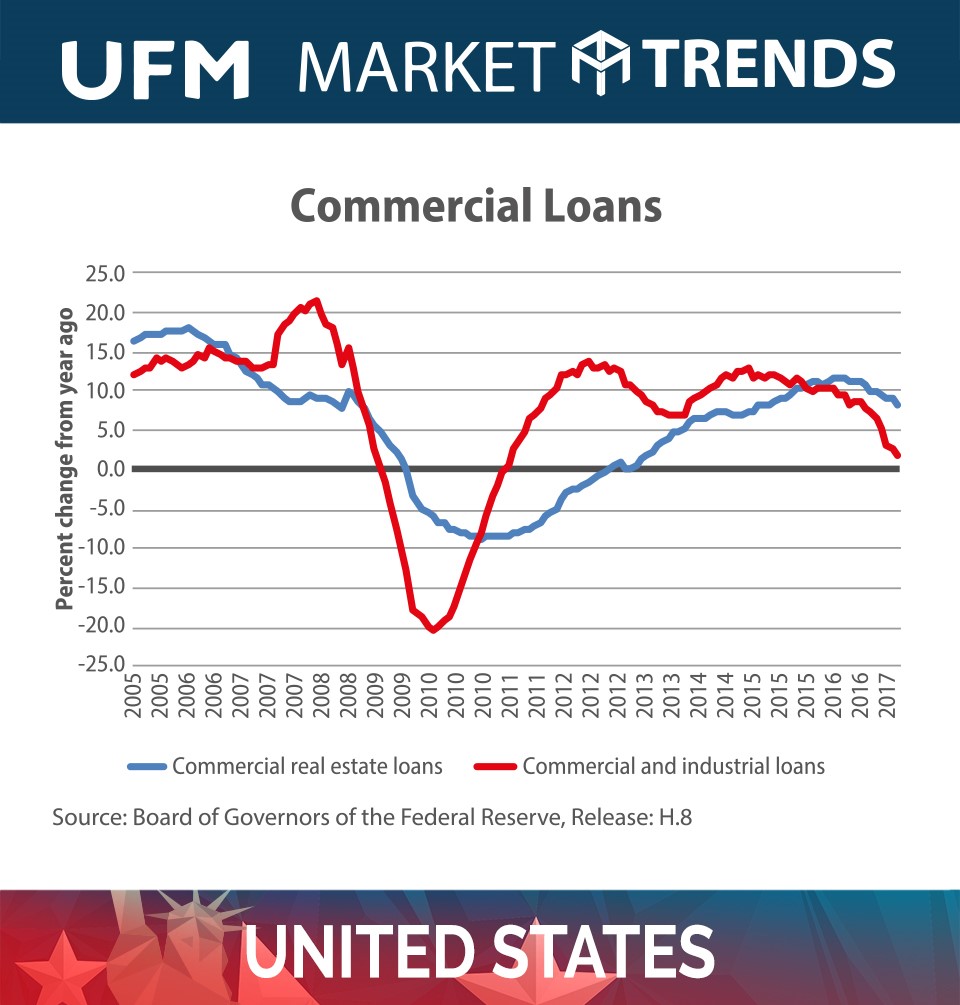
Corporate credit growth is weakening, but at a terrifying pace, I should have added. Far from exaggerating, this is actually what is going on at this very moment: the US banking sector is lending less and less to businesses: generally a sign that a recession is near.
We are only a step away from a decrease in total outstanding commercial and industrial bank credit.
What was the last time that corporate credit growth was this low? To answer this question, we have to go back in time and, to be precise, back to as far as the 2008 crisis. Commercial credit is cyclical and therefore a good indicator of where the economy is heading.
So much for the Fed hiking interest rates into economic strength: banks are lending businesses at a slower pace, not a growing pace. Either businesses do not want to borrow, or they simply cannot borrow (because they are already too overleveraged). Whatever the case may be, slowing credit growth is a sign of future economic weakness.
Concluding Remarks
Even though the headline numbers indicate that we are near economic Nirvana, the underlying data suggests otherwise. In the current Fed rate hike cycle, it seems as if above indicators will only further deteriorate instead of bouncing back to healthy levels. But we will have to wait and see. In the meanwhile, do not forget to read our Q2 2017 report on the US economy to learn more about other interesting trends that we tend to miss when we limit ourselves to reading the headline numbers.
Get our free exclusive report on our unique methodology to predict recessions

Olav Dirkmaat
Olav Dirkmaat is professor in economics at the Business School of Universidad Francisco Marroquín. Before, he was VP at Nxchange and precious metals analyst at GoldRepublic. He has a PhD in Economics from the King Juan Carlos University in Madrid. He has a master in Austrian Economics from the same university, as well as a master in Marketing Strategy from the VU University in Amsterdam. He is also the translator of Human Action of Ludwig von Mises into Dutch. He has a passion for investing, and manages funds for relatives, looking for investment opportunities in markets that are extremely over- or undervalued.
Get our free exclusive report on our unique methodology to predict recessions

Can’t fault your reasoning.
We must be both “Austrians” at heart.
let us exchange emails as I would like to keep in touch.
mine is ..
ron.manners@Mannkal.org
Ron Manners
http://www.mannkal.org
I was last at UFM in Jan 2015