The United States Enters a Recession

The United States, the world’s largest economy, has officially entered into a recession.
This article analyzes the economic growth data just released in the US and addresses many economists’ claim that the US economy has not actually entered a recession.
We will see, based on economic data, that the claim is unfounded. We are in the middle of a textbook recession. There is nothing special about this recession if we compare today’s economic activity indicators with those of other recessions. I also comment briefly on the move to redefine “recession.”
A Technical Recession?
The official definition of a recession is two consecutive quarters of declining GDP. One can agree or disagree with this definition, but it certainly does not make sense to change the definition when it suits us. This is what economists who are close to those in power in the US seem to be trying to do. This is why the expression “technical recession” is becoming popular.
A huge number of economic analyses are claiming that the economy is actually healthy and that there is nothing to fear. To justify this, the analysts cite data other than GDP. I discuss this later. For now, let us look at the economic growth data.
Figure 1
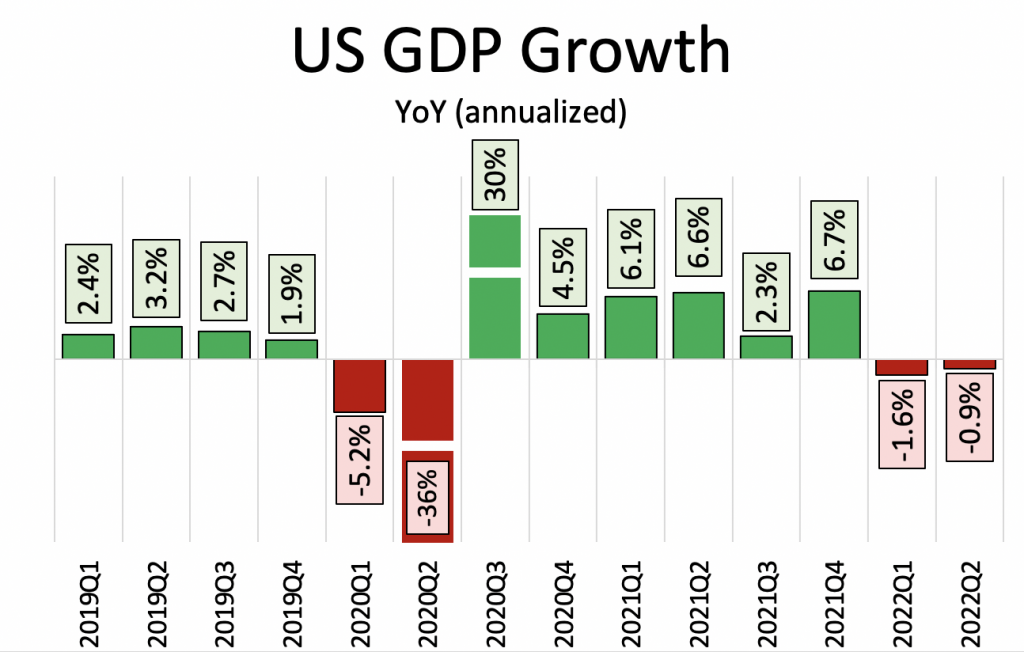
Source: Prepared by the author with data from the St. Louis Fed
As can be seen in figure 1, US GDP recovered from the post-COVID recession by the third quarter of 2020. Since then, the US recorded more or less pronounced positive growth until the first quarter of 2022. Contrary to all forecasts, economic growth was negative at the beginning of 2022. The data for the second quarter of 2022 also show a drop in GDP.
Thus, we can confirm a drop in GDP for two consecutive quarters. Therefore, there is little doubt: the US economy has officially entered a recession.
The news of the US economy entering a recession should be anything but a surprise, yet markets—perhaps too accustomed to unrestrained public support and overoptimism—expected growth.
Figure 2
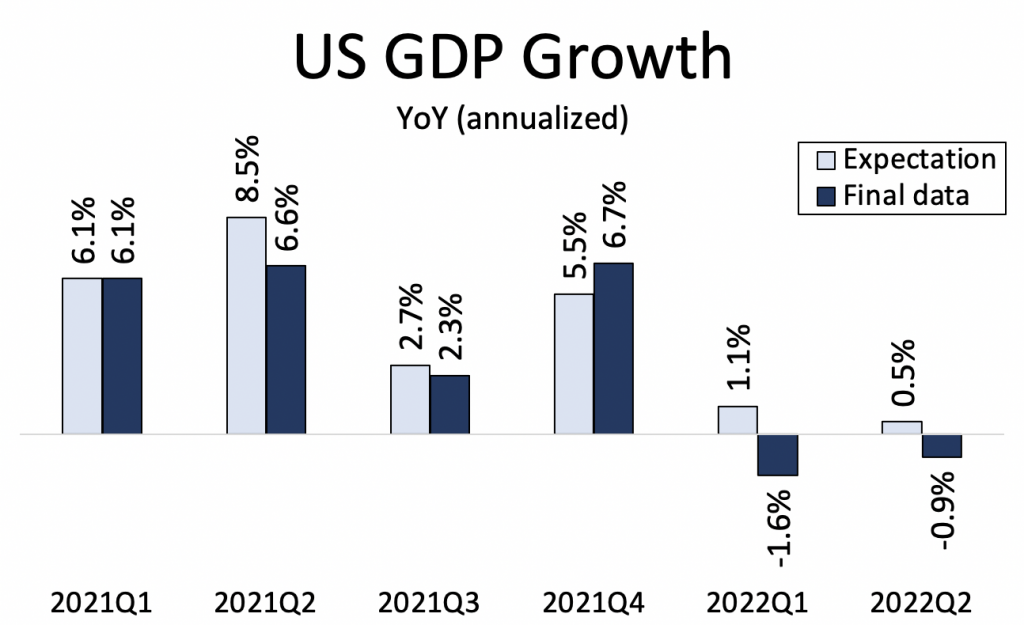
Source: Prepared by the author with data from the St. Louis Fed and Investing.com
As seen in figure 2, in both the first and second quarters of 2022, growth was expected to be positive.
In the first quarter of 2022, year-on-year growth was expected to be very weak at 1.1 percent, while the actual figure was −1.6 percent. In the second quarter of 2022, growth was expected to be even weaker, at only 0.5 percent year-on-year. However, it fell by almost 1 percent.
The market consensus did not expect the recession, although it anticipated a declining growth rate.
Is the GDP Indicator Enough to Decree a Recession?
Many economists are criticizing the official definition of a recession or even the use of GDP as an economic indicator, and there are good grounds for both criticisms. The problem lies in wanting to change definitions or standards for the convenience of political discourse. This is cheating.
Let us accept, for argument’s sake, that the definition of recession is not what it is and that alternative economic data might encourage us to be more optimistic about the near future. Let us see, therefore, whether everything else in the economy is in good shape.
The Labor Market
The US economy continues to create jobs despite being in a recession. Virtually all labor market indicators seem to indicate that the economy is in good shape. At least, that is what economists who claim that there is currently no recession are arguing.
These economists forget that the labor market has a delayed reaction. That is, a recession occurs first, and only after that do labor market data worsen. And when the economy starts to grow, the labor market usually lags somewhat. That is, new jobs are created only after the recovery has already taken place. This kind of indicator is referred to as a lagging indicator.
One of the most widely tracked indicators in the labor market today is the number of unemployed people per job opening. A ratio of two means that for every job vacancy in an economy, there are two unemployed individuals.[1]
Let us examine how the number of unemployed persons per job opening has evolved in the US in recent years.
Figure 3
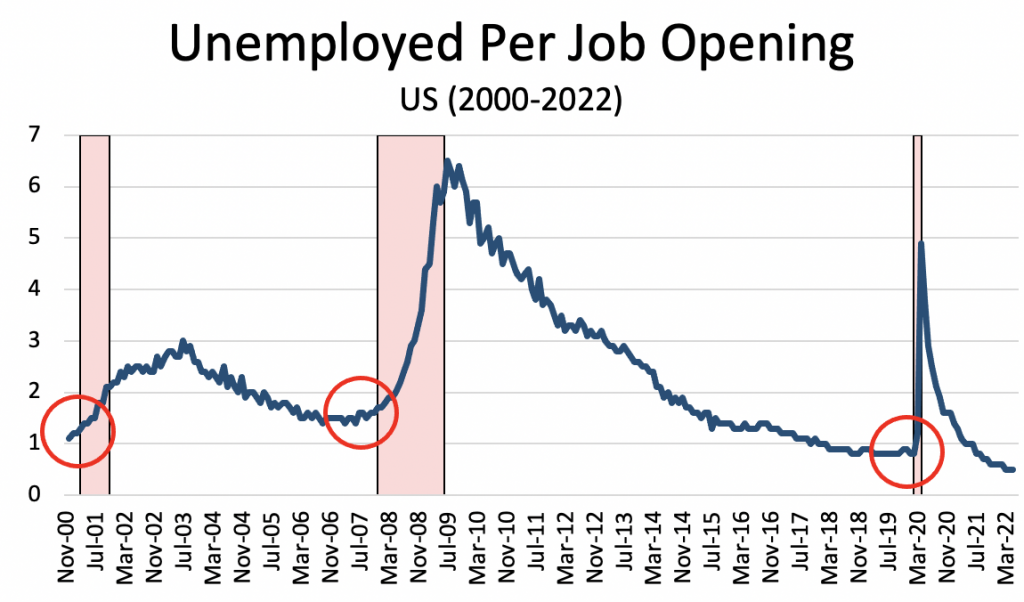
Source: Prepared by the author with data from the US Bureau of Labor Statistics and the National Bureau of Economic Research
The blue line in figure 3 represents the indicator’s level. At the beginning of 2010, it peaked at almost seven. This is normal, considering that in the middle of the biggest recession in recent memory, a great many jobs were destroyed and it took a long time to create them again. This caused the number of job openings (the denominator) to plummet and the number of unemployed people (the numerator) to skyrocket.
Meanwhile, the pink areas show the periods of recession in the United States according to the National Bureau of Economic Research. Note the red circles, which indicate what in mathematics are called local minimums. In this case, the labor market indicator hit lows just before a recession hit.
The ratio is currently at an all-time low. Far from meaning that the US economy is healthy, as some analysts would have us believe, it is a symptom of the opposite. A very overheated labor market is the prelude to a recession. This was true in the past and is true today.
Therefore, the labor market data tell us nothing positive about the US. A similar analysis could be undertaken for economies that have not yet officially entered a recession but are likely to enter a recession in the near future, namely China and Europe.
Incomes Continue to Grow
Let us look at more data presented by analysts who argue that the US economy is healthy. According to them, recessions occur at the same time that people’s incomes fall. But people’s incomes continue to grow, so we should dismiss the notion that we are swimming in recessionary waters.
First, consider private income data for the US economy.
Figure 4
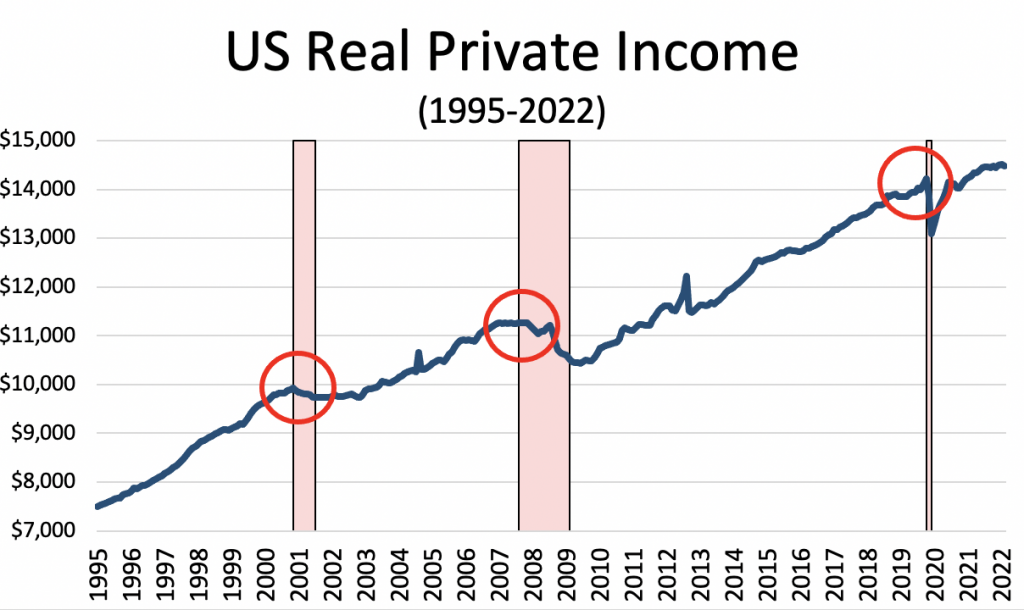
Source: Prepared by the author with data from the St. Louis Fed and the National Bureau of Economic Research
This graph is very similar to the previous one. The pink areas show the periods in which the US economy suffered a recession, and the blue line represents citizens’ private incomes—that is, their income before any government transfer.
The analysis of private income yields similar results to the analysis of the labor market: as economists close to the government tell us, the income of citizens falls in a recession. There is no question about this. The problem is that citizens’ income falls after the recession takes shape, not before. The June 2022 data, the latest available, already show stagnation and even a slight fall in the private income of Americans, which is perfectly compatible with the beginning of the US recession. Therefore, in this case too, those who argue that the economy remains strong are using a lagging indicator of recession, not a leading one.
In other words, that income has not yet fallen significantly is not proof that we are not in a recession; rather, incomes are following the typical path of a recession.
Industrial Production
Let us now look at another indicator leading many to assume the US economy is strong: industrial production.
The industrial-production indicator is losing importance as the service sector gains significance in modern developed economies relative to the industrial sector. However, this indicator is still used by some economists to analyze the stage of the economic cycle.
Consider how industrial production in the United States has performed in recent years.
Figure 5
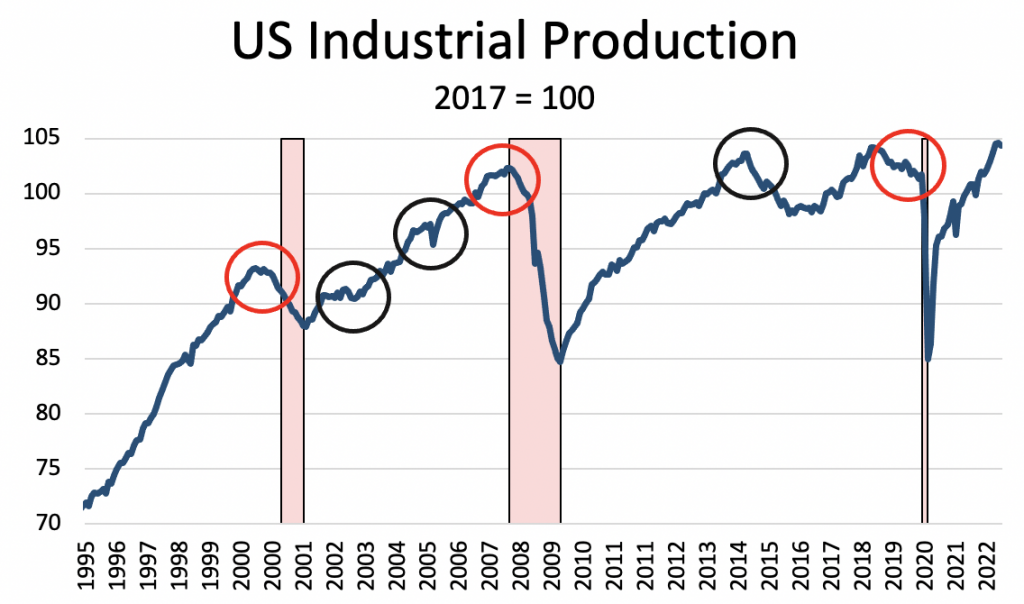
Source: Prepared by the author with data from the St. Louis Fed and the National Bureau of Economic Research
The red circles show how industrial production behaved before the last three recessions. In the 2001 recession, it served as a leading indicator. In the 2008 recession, it was a lagging indicator. In the 2020 recession, the indicator gave warning signs perhaps too early, as it had been falling since 2018.
Perhaps the most relevant aspect of industrial production can be found in the black circles. These indicate the periods during which the indicator provided poor information. In 2003, 2005, and 2015 (and possibly a few more times), industrial production fell even though no recession occurred afterward. In other words, industrial production is an unreliable indicator of recession because it gives many false positives (that is, signs of recession when a recession does not actually take place). It is also a bad indicator because when it is not yielding poor information, it sometimes behaves as a leading indicator of recession and other times as a lagging indicator.
In short, if we want to anticipate recession, it is best not to even analyze industrial production, at least not in the United States.
Leading Indicators of Recession
So far, we have seen that most of the indicators used by the economists critical of the traditional definition of recession are lagging indicators. Therefore, they are useful indicators for academics undertaking post hoc analysis, but their usefulness is more than dubious for professionals operating in the market.
However, a number of other leading indicators usually worsen before a recession. They are very useful for seeing how the economy will behave in the coming months or quarters.
Let us look at how these indicators have been performing to see whether they have behaved as they typically do in a recession or whether the critics are right.
Yield-Curve Slope
The slope of the yield curve is probably the best leading indicator of economic activity and the most reliable signal of recession we have today. It is established in the economic literature as a very reliable indicator, although curiously there is no unequivocal explanation as to why that is.
For our purposes, suffice it to say that the yield curve usually resembles the shape seen in figure 6.
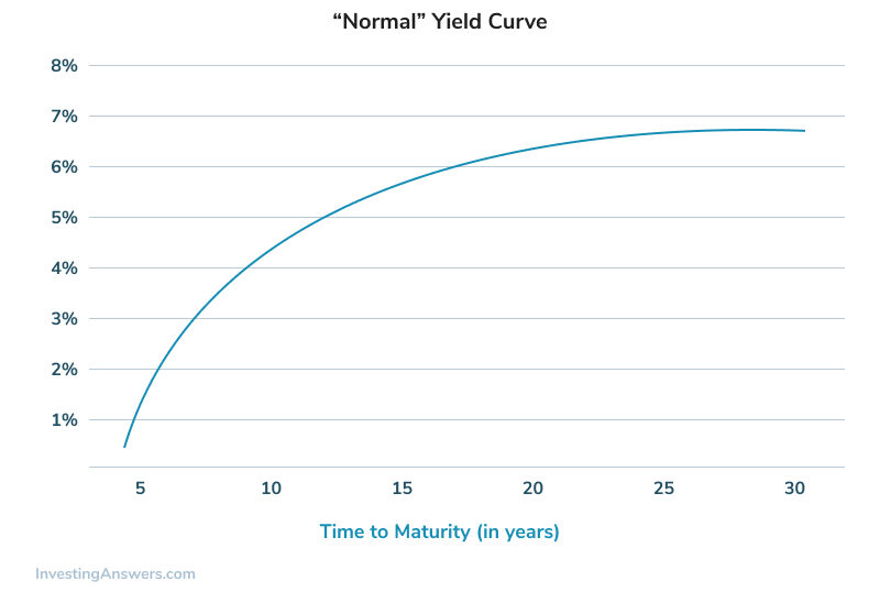
In normal times, the long-term interest rate is higher than the short-term interest rate because of a risk premium and a liquidity premium.
Let us now look at what has happened to the interest rate differential in recent years in the United States.
Figure 7
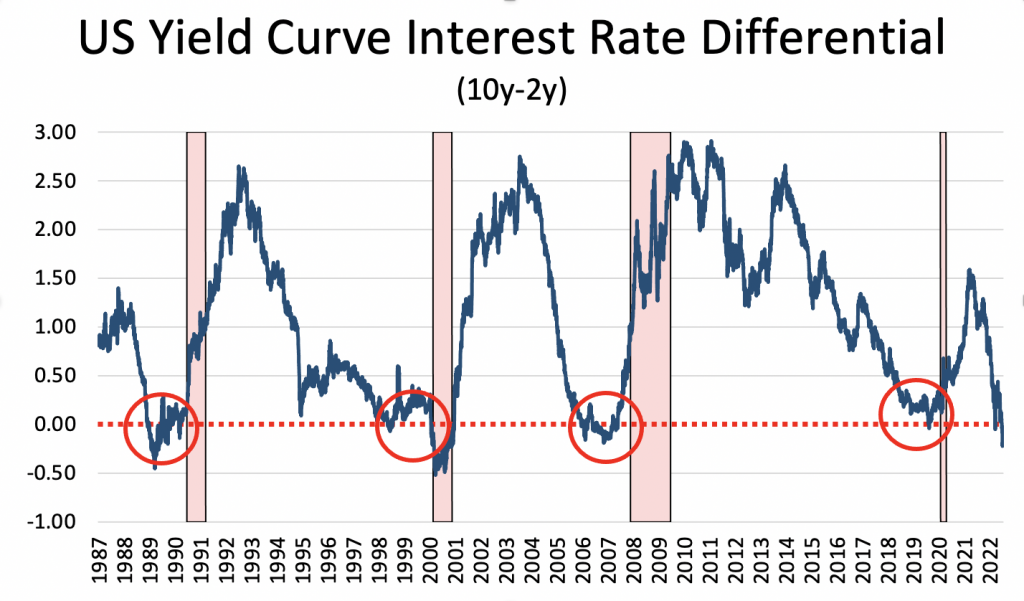
Source: Prepared by the author with data from the St. Louis Fed and the National Bureau of Economic Research
Figure 7 shows the differential between ten-year and two-year interest rates in the US. As mentioned, when the spread is positive the situation is normal: the long-term interest rate is higher than the short-term interest rate. If the spread is negative, we should expect a recession in the near future.
As can be seen in figure 7, each time the interest rate differential has gone negative, a recession has appeared in the near future. The figure shows that the interest rate differential has predicted recessions since 1990, but the academic literature establishes this relationship for older recessions as well.
How does the spread look now? Atrocious. It has been plummeting since 2021 and became negative this year. In other words, the best recession signal is in the red. It is no wonder that the economy has entered a recession.
Atlanta Fed’s GDPNow
Another leading indicator is the Atlanta Fed’s GDPNow—a synthetic, or composite, indicator. GDPNow collects leading indicators, which is useful because it saves time in analyzing and compiling the many leading indicators. Of course, one should always be careful with these types of composite indicators, as they could include indicators that are not really leading indicators or give too much weight to more or less irrelevant indicators and too little weight to crucial indicators.
Let us see what the Atlanta Fed forecast with its collection of leading indicators.
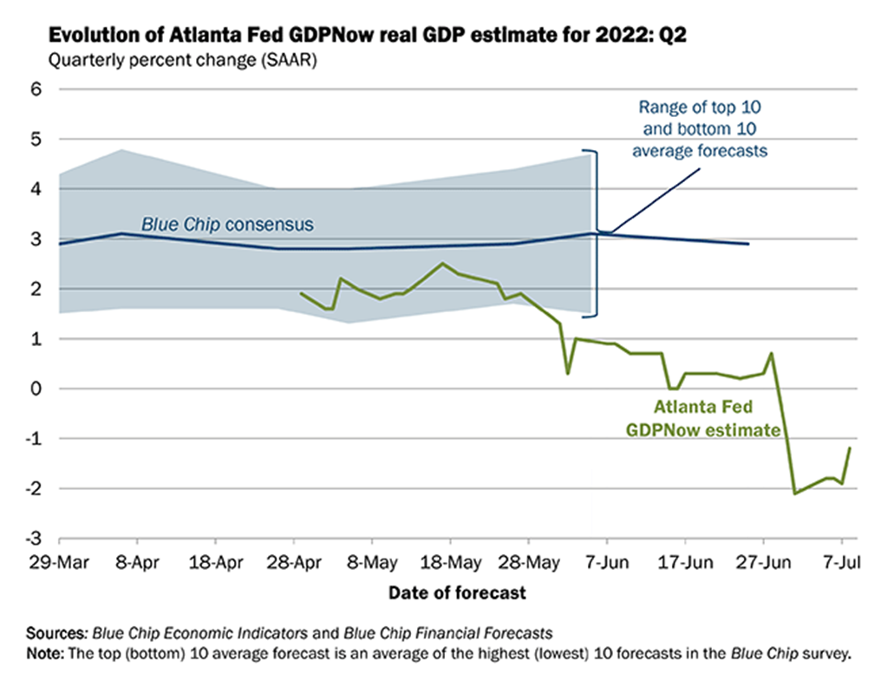
As can be seen in figure 8, the Atlanta Fed estimated that GDP would fall by 1.2 percent in the second quarter of 2022. The actual decline was 0.9 percent, so the Atlanta Fed has done a good job of collecting leading indicators.
As forward-looking data came out, the Atlanta Fed constantly revised its growth forecast downward. Yet the predictions of the most influential economists barely wavered. They were unable to see that a recession was coming, even though most leading indicators showed it.
Conclusion
In short, we are in the middle of an almost textbook recession. No indicator is showing strength in the economy. With a little common sense, we could have predicted that recession was at our doorstep. That many economists lacked common sense prevented them from seeing this.
Rather than accepting their mistake, arrogant academic economists continue to claim that the activity indicators are perfect and that, therefore, despite the official definition of inflation, the US economy is in great shape.
Other, perhaps more Machiavellian, economists are trying to change the definition of recession to make reality fit their flawed models of how the world works. Thus, the insatiable ego of many economists will be satisfied when they repeat on television a thousand and one times that we are not in a recession. But you, dear reader, know the truth: we are in the middle of a real recession. The problem, moreover, is not going to stay in the United States; the next to fall will most likely be Europe and China, economies that hardly anyone can argue are in better shape than the US.
Legal notice: the analysis contained in this article is the exclusive work of its author, the assertions made are not necessarily shared nor are they the official position of the Francisco Marroquín University.
–
Notes
[1] Of course, this is an aggregate indicator: there are many more unemployed persons than job openings in some sectors, and the opposite is true in others.
Get our free exclusive report on our unique methodology to predict recessions

Daniel Fernández
Daniel Fernández is the founder of UFM Market Trends and professor of economics at the Francisco Marroquín University. He holds a PhD in Applied Economics at the Rey Juan Carlos University in Madrid and was also a fellow at the Mises Institute. He holds a master in Austrian Economics the Rey Juan Carlos University and a master in Applied Economics from the University of Alcalá in Madrid.
Get our free exclusive report on our unique methodology to predict recessions
