India Report – References and Annexes
The Failure of Industrial Policy: India as a Case Study
References and Annexes
Annexes
Annex A
Selection of the Countries in the Donor Pool
After preselecting possible countries for the donor pool of the synthetic India, it was necessary to define the variable to be measured and its predictors. The main variable used was GDP per capita, as it is the best available aggregate to measure a country’s economic performance. For predictors of GDP per capita, we used the investment rate as a percentage of GDP, the fertility rate, the interest rate as a percentage of GDP, and the years of schooling among men aged twenty-five and older. We chose these predictors because the augmented Solow model considers them determinants of economic growth (Mankiw, Romer and Weil 1992, 432). Furthermore, we used other variables that are important to India specifically, such as total imports and exports. India was very protectionist before it liberalized in 1991 and the synthetic India needs to reflect this. Additionally, we used lagged GDP-per-capita figures of 1970, 1980, and 1990 to account for the convergence effect. These data were obtained from the World Bank and the Institute for Health Metrics and Evaluation.
Annex B
Comparison of the Predictor Values
The following table shows how the predictor variables of the group of countries that make up the synthetic India compare to the real India.
Table B1. Predictor values for the real India and its synthetic counterpart for the period prior to treatment
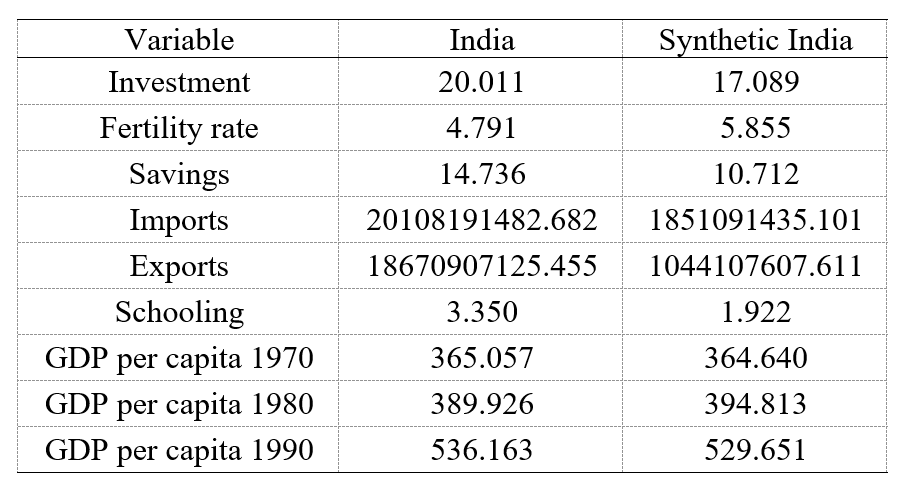
The reason for the divergence in the values of variables of the real India and its synthetic counterpart is that the model considers the explanatory power of these variables for GDP per capita low, while the explanatory power is higher with variables for lagged GDP per capita, where the values are closer (Abadie et al. 2010, 500).
Annex C
Placebo Test to Determine the Validity of the Model
We ran a placebo test to determine whether the results of this process are significant and valid. We repeated the procedure for each country of the donor pool as if that country had liberalized in 1991 instead of India, moving India to the donor pool at the same time (Abadie et al. 2010, 501). Table C1 calculates the error of each test for each country and classifies the errors by their magnitude.
Table C1. Placebo test 1: MSPE and RMSPE for each country
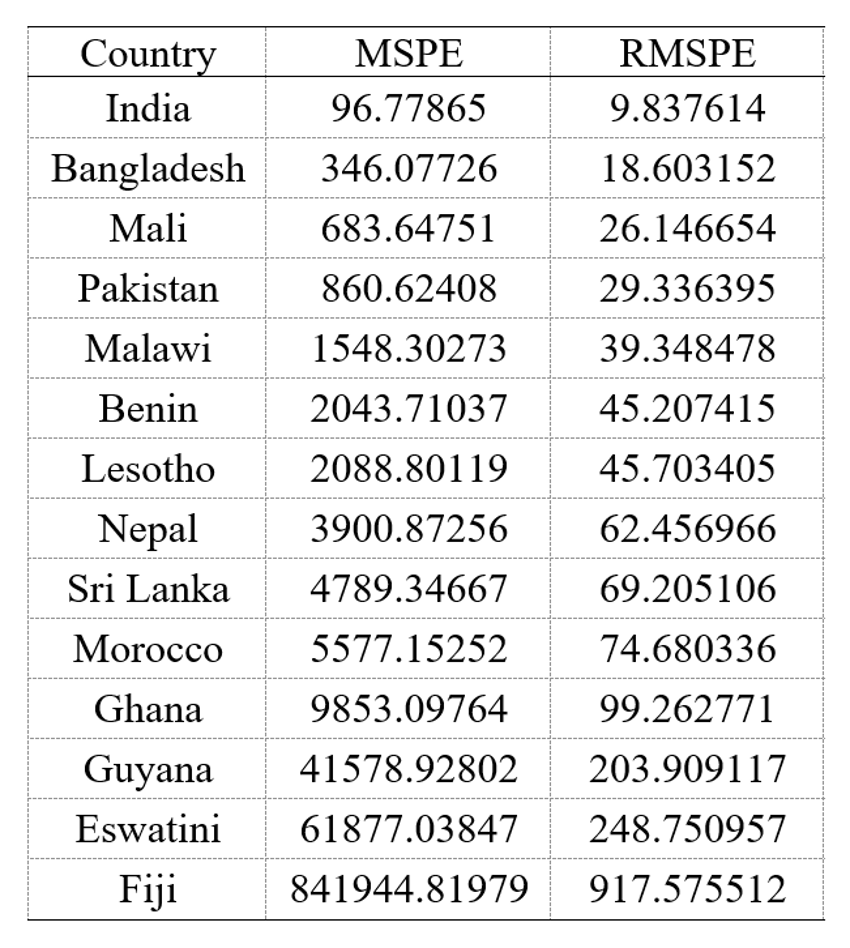
India is, by far, the country where the synthetic control has the smallest amount of test error in the period prior to the treatment, almost half the amount found for Bangladesh.
To further support this result, we plotted the gaps between each synthetic country and its real counterpart in figure C1.
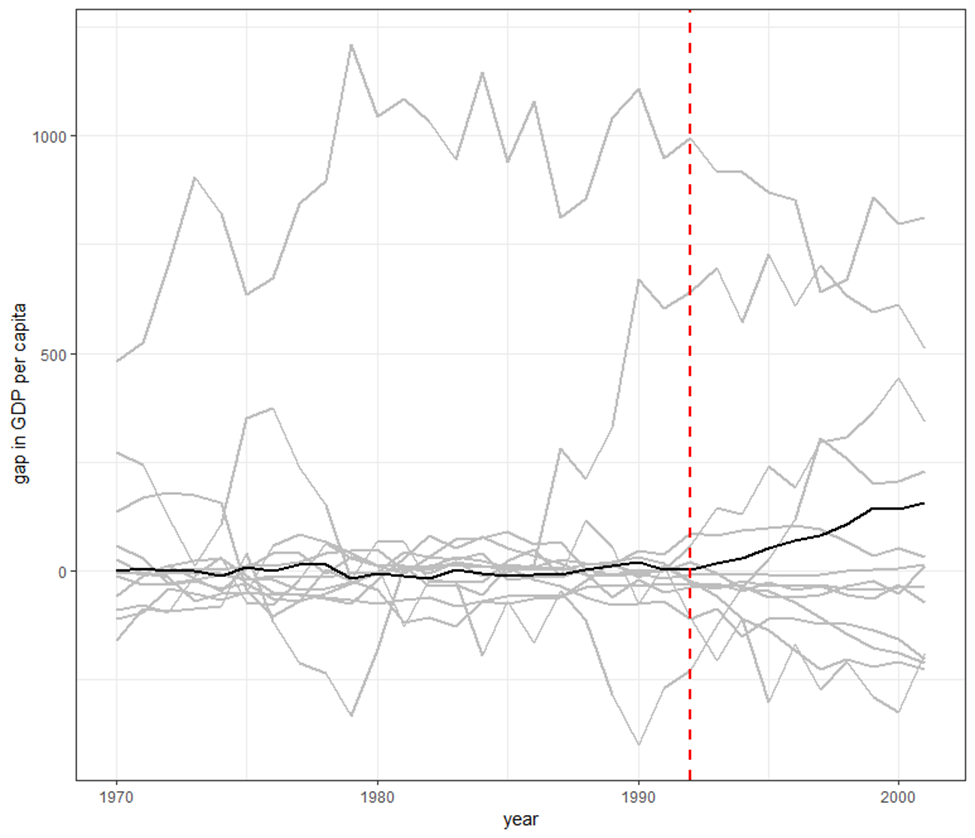
Figure C1. Gap between the real GDP per capita of each donor country and the values predicted by its synthetic counterpart
The black line represents India, while the rest of the lines represent the other countries. One can see how the gap in real GDP per capita before treatment (represented by the dotted line) is minimal. The line is almost horizontal and at zero, but it rises after the treatment.
To see this more clearly, in figure C2 we eliminated the countries considered outliers (Ghana, Guyana, Eswatini, Fiji, Morocco, and Sri Lanka).
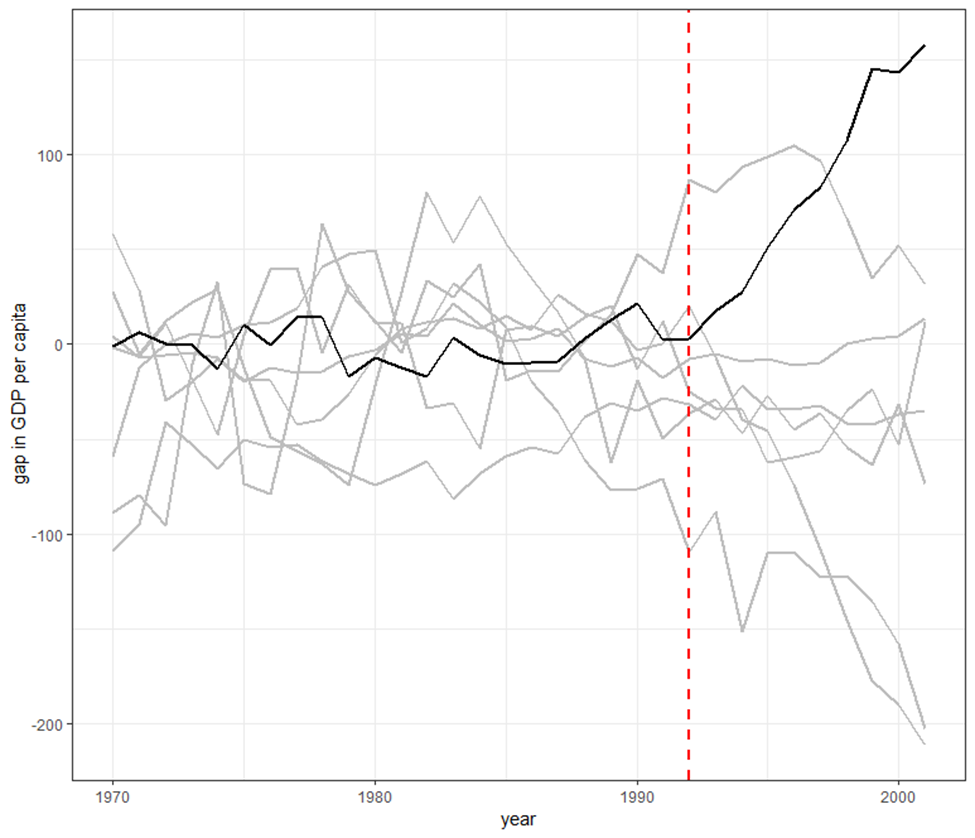
Figure C2. The gap between the real GDP per capita of each donor country and the values predicted by its synthetic counterpart, eliminating those with an MPSE that is 40 times greater, or more, than India’s
Upon reducing the scale of the graph by eliminating the extreme values, one reaches the same conclusion as in figure C1. India continues to be the country where the gap does not diverge much from zero prior to the treatment, while there is a significant gap after liberalization. Importantly, it is one of the largest gaps. Although some lines have gaps of greater value to the left of the red-dotted line, these lines’ error prior to treatment is also greater.
We performed a final robustness test that consists of calculating the rate between the MPSE after 1992 and the MPSE before 1992 (see table C2) and making a histogram of the data (see figure C3). The logic is that, after the treatment, synthetic India is no longer a good predictor of real India. Accordingly, its error is significantly greater than the pretreatment error, when synthetic India is expected to be a good predictor of real India and its error is low.
Table C2. MPSEs for the periods 1970–91 and 1992–2002 and the rate between these for donor countries
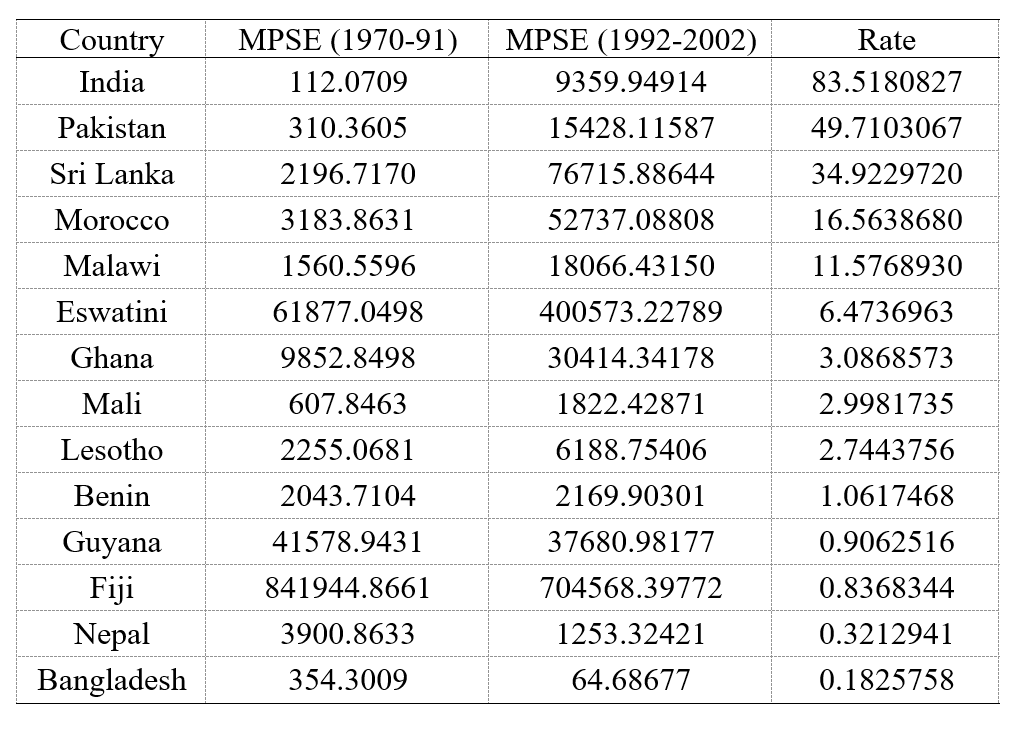
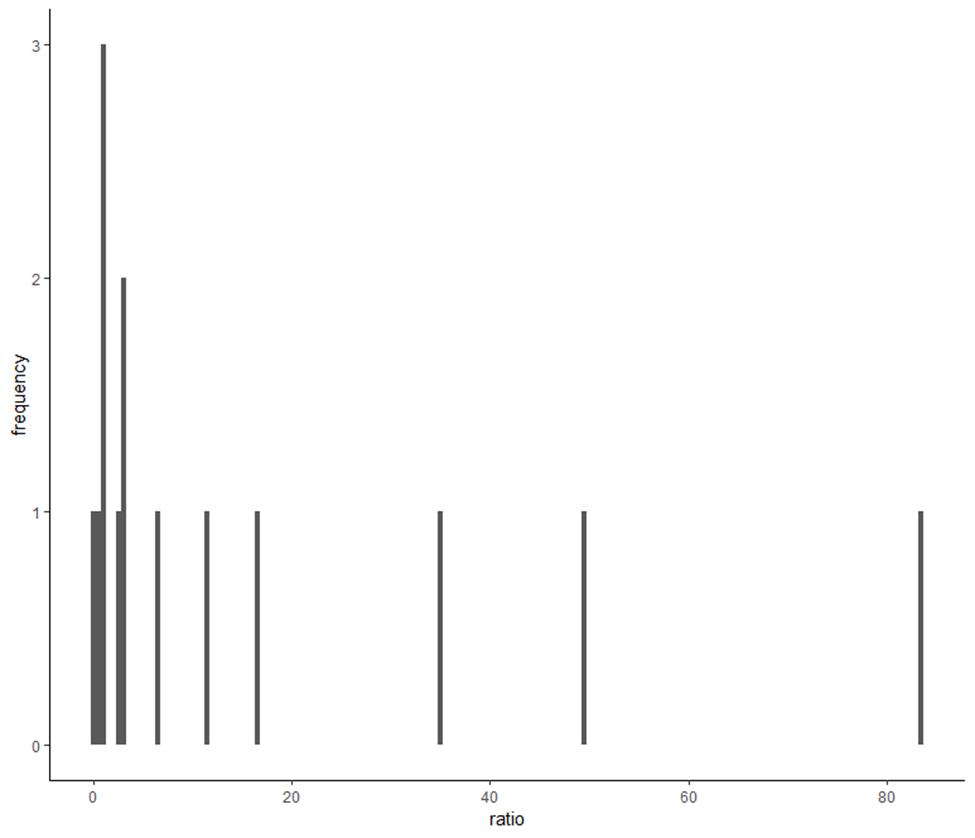
Figure C3. Histogram of the rate between the 1992–2002 MPSE and the 1970–91 MPSE for all donor countries
India’s rate is the highest among all of the countries, as its MPSE after the treatment is eighty-three times higher than its MPSE prior to the treatment. This lends robustness to the model since the treatment causes synthetic India to no longer be a good replica of real India, at such a magnitude that no other country in the placebo tests achieves.
References
Abadie, A., Diamond, A. and Hainmueller, J. (2010). Synthetic Control Methods for Comparative Case Studies: Estimating the Effect of California’s Tobacco Control Program. Journal of the American Statistical Association, 105, 493–505. https://doi.org/10.1198/jasa.2009.ap08746
Bergh, A. and Karlsson, M. (2010). Government size and growth: Accounting for economic freedom and globalization. Public Choice, 142, 195–213. https://doi.org/10.1007/s11127-009-9484-1
Cole, J. H. (2003). The Contribution of Economic Freedom to World Economic Growth, 1980-99. Cato Journal, 23, 189–198. Retrieved from https://object.cato.org/sites/cato.org/files/serials/files/cato-journal/2003/11/cj23n2-3.pdf
Dam, S. (1965). DEMOCRATIC SOCIALISM IN INDIA. The Indian Journal of Political Science, 26, 118-123. Retrieved from http://ezproxy.ufm.edu:2052/stable/41854089
Devereux, M. B. (1997). Growth, Specialization, and Trade Liberalization. International Economic Review, 38, 565–585. https://doi.org/10.2307/2527281
Emran, M. S., Shilpi, F. and Alam, M. I. (2007). Economic Liberalization and Price Response of Aggregate Private Investment: Time Series Evidence from India (Libéralisation économique et réponse des prix de l’investissement privé agrégé: résultats enregistrés par les séries chronologiques pour l’Inde). The Canadian Journal of Economics / Revue canadienne d’Economique, 40, 914–934. Retrieved from http://ezproxy.ufm.edu:2052/stable/4620637
Galindo, A., Micco, A., Ordoñez, G., Bris, A. and Repetto, A. (2002). Financial Liberalization: Does It Pay to Join the Party? [with Comments]. Economía, 3, 231–261. Retrieved from http://www.jstor.org/stable/20065435
Gwartney, J., Lawson, R., and Norton, S. Economic Freedom of the World. The Fraser Institute. Retrieved from https://www.fraserinstitute.org/economic-freedom/dataset
Institute for Health Metrics and Evaluation (IHME). GBD Compare. Retrieved from http://vizhub.healthdata.org/gbd-compare.
Kotwal, A., Ramaswami, B. and Wadhwa, W. (2011). Economic Liberalization and Indian Economic Growth: What’s the Evidence? Journal of Economic Literature, 49, 1152–1199. https://doi.org/10.1257/jel.49.4.1152
Mankiw, N. G., Romer, D. and Weil, D. N. (1992). A Contribution to the Empirics of Economic Growth. The Quarterly Journal of Economics, 107, 407–437. https://doi.org/10.2307/2118477
Sanders, S. W. (1977). India: Ending the Permit-License Raj. Asian Affairs, 5, 88–96. Retrieved from http://ezproxy.ufm.edu:2052/stable/30171608
Thakur, R. (1993). Restoring India’s Economic Health. Third World Quarterly, 14, 137–157. Retrieved from http://ezproxy.ufm.edu:2052/stable/3992587
Townsend, R. M. and Ueda, K. (2010). WELFARE GAINS FROM FINANCIAL LIBERALIZATION. International Economic Review, 51, 553–597. Retrieved from http://www.jstor.org/stable/40784797
World development indicators. Retrieved from https://search.library.wisc.edu/catalog/999829583602121


