The US Economy: Same as It Ever Was?

The United State’s economic growth report for the second quarter of 2016 was recently published on July 29, and its results are both expected and unexpected, depending from which perspective it is seen. On the one hand the information shows a pre-crisis, on the other a post-2008 crisis.
What are these perspectives?
Graph 1 shows the quarterly seasonality calculations of the GDP growth rate. In the graph seasonality has been calculated for two identical periods of 30 quarters, one from 2009 to 2016 and the other from 2002 to 2008. Specifically, the graph shows how seasonality behaved before and after the 2008 crisis.
Graph 1
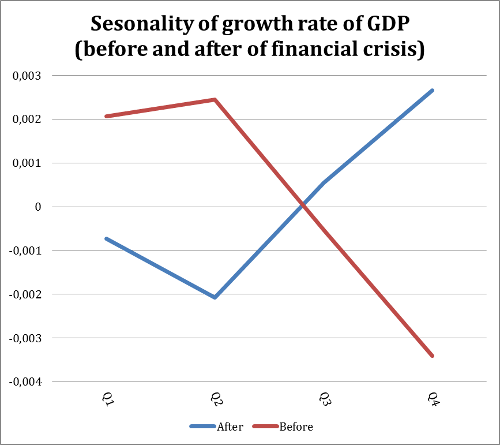
Source: Prepared with data from Bureau of Economic Analysis
The graph shows inverse seasonality. Before the 2008 crisis, the first and second quarters of the year tended to have relatively higher growth than the third and fourth quarters. In the post-crisis period seasonality is inverse: the third and fourth quarters have relatively better growth. From the perspective of seasonality before the crisis, the 1.2% figure is not encouraging; it means we should expect less growth at the end of the year. From the perspective of seasonality post-crisis, we can expect a growth higher than 1.2% at the end of the year, becoming a little more optimistic.
What should we expect?
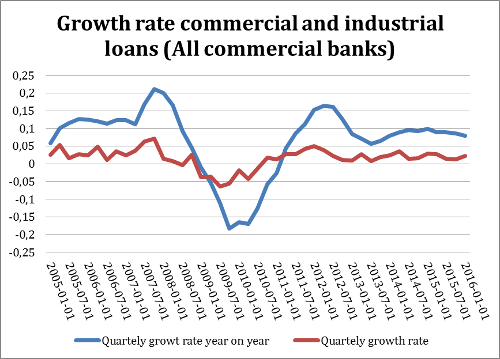
Graph 2 shows the quarterly annualized growth rates of the United States after the 2008 crisis. Even though the trend seems positive, the growth rate has been declining since the first quarter of 2015.
Graph 2

Source: Prepared with data from Bureau of Economic Analysis
However, other important data signaling the vitality of the American economy show a different picture. For example, employment grew as 255,000 new jobs were created in July. Although this number is lower than last year’s, given the circumstances of growth reported, it is above expectations. The unemployment rate remains at 4.9%, indicating that the participation of the population in the work force should have increased. Another discouraging sign is the productivity report, which shows a reduction of -0.6% in the first quarter of 2016. During the first quarter of 2015, productivity increased 0.7%.
The future of the US economy is uncertain, but it seems less likely to have a major re-aiming in the second quarter of 2016 than continue with a tendency to decrease.
What other variables should be analyzed?
Normally, monetary aggregates, and the evolution of credit and inflation should be analyzed. A key element in the evolution of credits is the evolution of defaults, they can reveal whether the economy is healthy or not. The analysis of monetary aggregates will be seen in detail in the next quarterly report of the economy of the United States. The analysis of the growth of industrial and commercial lending is seen in the following graph.
Graph 3
Source: Based on data from the Federal Reserve Bank of San Luis
Commercial and industrial credit is growing positively, but they do not reach the levels of an expanding economy. The second half of 2016 shows a decline compared to previous years. Graph 4 shows the default rate of the loans specified in Graph 3.
Graph 4
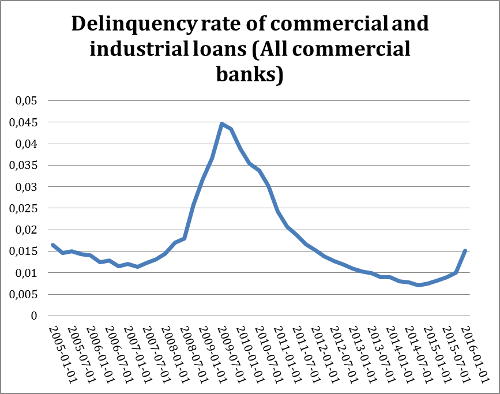
Source: Based on data from the Federal Reserve Bank of San Luis
Graph 4 shows that in the years prior to the 2008 crisis, default rates of industrial and commercial lending in the US commercial banks have been declining. An exception to this has been the last two quarters reported, until the first quarter of 2016, which show a change in trend. Statistically, 3 quarters are needed to imply a change of trend, but economically a change could be predicted.
So, is the economy of the US the same as always?
The analysis of the given information is not conclusive. The annualized quarterly GDP is growing, but it has been growing at a lower rate since the third quarter of 2015. Commercial and industrial credit is growing at a rate of an economy that is not expanding. Yet, in the last two quarters loan defaults have been rising. Two hundred and fifty five thousand new jobs are being created, but the unemployment rate has not changed because the levels of participation in the labor force are recovering slowly. Inflation is beginning to react, but it still remains below the Fed’s target.
Most unsettling is the changing trend of pre- and post-crisis seasonality. This leads to the following hypothesis: the economic agents of the United States learned from the last crisis that they should not be fooled by the monetary policies of the Federal Reserve. Besides, their business and entrepreneurial culture shows that the economy is being reshaped into a more virtual economy, which in the long term will surely reshape the traditional analysis of all economic theories.
Get our free exclusive report on our unique methodology to predict recessions

Clynton López
Clynton López is a professor at the Francisco Marroquín University since 2002 in the areas of economics and philosophy. He has a degree in Economics with a specialization in Finance from the Francisco Marroquín University and a master in Economics from the same university, both Magna Cum Laude. He studied executive programs at Boston University on Managerial Economics & Corporate Finance, the Master of Philosophy at the Rafael Landívar University (specialization in phenomenology), and the Post Graduate Degree in INCAE for Senior Management. In the professional field he has more than 10 years of management experience in banking and financial companies in Guatemala, California and Puerto Rico, and is a member of the Mont Pelerin Society.
Get our free exclusive report on our unique methodology to predict recessions
