Liquidity Gap
We propose the liquidity gap indicator as a way to measure the maturity mismatch caused by financial intermediation. This indicator uses the following ratio:
The indicator shows the relationship between the proportions of short-term and long-term liabilities on one hand, and short-term and long-term assets on the other.
In the absence of any maturity mismatch, we would expect the indicator to be close to one. This would indicate that the cash outflows committed to the short term are offset by short-term cash inflows. In other words, long-term assets are financed with long-term liabilities.
However, this indicator usually shows an elevated numerator and a smaller denominator, signaling that the proportion of short/long liabilities is much higher than the short/long assets ratio. This is a sign that the financial sector is trading on maturities.
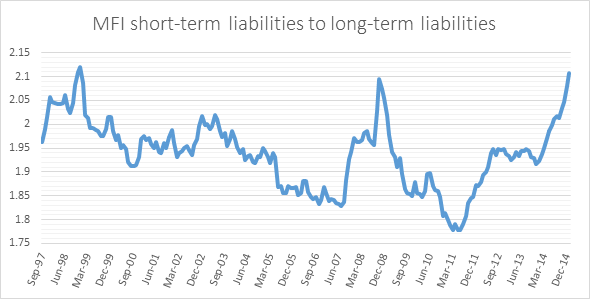
In fact, in the historical data series for the Eurozone financial system we see that the short-term liabilities far outweigh the long-term liabilities.
Source: Original arrangement compiled from ECB data.
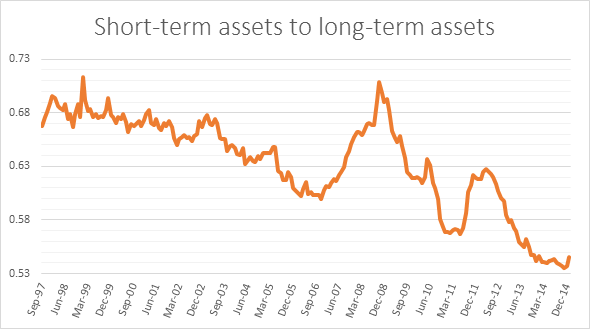
Similarly, short-term assets are much lower than long-term assets.
Source: Original arrangement compiled from ECB data.
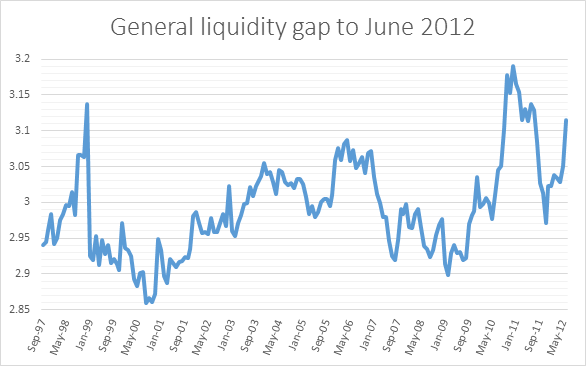
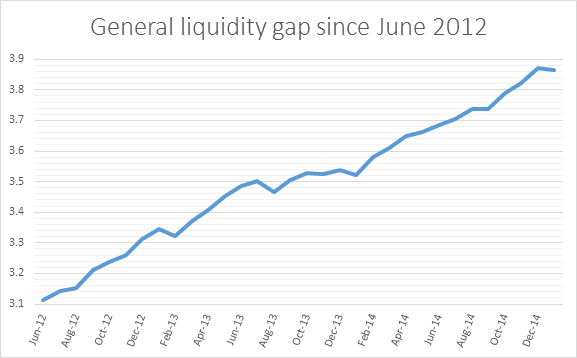
In short, the maturity mismatch is evident in our indicator.
Source: Original arrangement compiled from ECB data.
Source: Original arrangement compiled from ECB data.
When the liquidity gap decreases abruptly it means that a liquidity crisis is developing in the system. These liquidity crises, along with a reversal in the yield curve, are the precursors to an economic crisis.
Our indicator will return four possible outcomes: low risk, in which the liquidity gap remains stable; medium or increased risk, in which the liquidity gap increases; medium-high risk, where the liquidity gap dramatically decreases; and very high risk, in which the liquidity gap decreases abruptly and remains low.
|
Risk Value |
Status |
|
1 |
Ongoing mismatch |
|
2 |
Growing mismatch |
|
3 |
Liquidation phase begins |
|
4 |
Liquidation phase consolidates |
When the liquidation of financial assets phase is consolidated, the liquidation of real assets usually follows. Using data from the European Central Bank, the indicator is able to predict the crisis of 2008 well in advance. The financial sector systematically strives to increase liquidity from March to September 2007, and as a result, the real economy caves in shortly thereafter.
|
dec-07 |
2 |
|
nov-07 |
1 |
|
oct-07 |
2 |
|
sep-07 |
4 |
|
aug-07 |
4 |
|
jul-07 |
4 |
|
jun-07 |
4 |
|
may-07 |
4 |
|
apr-07 |
4 |
|
mar-07 |
4 |
|
feb-07 |
2 |
|
jan-07 |
2 |
Similarly, we can anticipate the European debt crisis of 2012.
|
may-12 |
2 |
|
apr-12 |
1 |
|
mar-12 |
2 |
|
feb-12 |
2 |
|
jan-12 |
4 |
|
dec-11 |
4 |
|
nov-11 |
4 |
|
oct-11 |
4 |
|
sep-11 |
4 |
|
aug-11 |
4 |
|
jul-11 |
2 |
|
jun-11 |
4 |
|
may-11 |
2 |


